The Santa Claus Rally refers to a historically observed stock market phenomenon where equities tend to rise during the last five trading days of December and the first two trading days of January. While not guaranteed, this pattern has been noted by traders and analysts for decades.
Timing:
- The rally occurs during the final stretch of the year and spills into the start of the next year.
- Specifically, it includes the five trading days after Christmas and the first two trading days of January.
Average Gains:
- Historically, the S&P 500 has shown an average gain during this period, often outperforming the average seven-day period throughout the year.
Historical Reliability:
- Research shows the rally has occurred roughly 75% of the time since it was first identified.
Looking at the S&P 500 (SPY) historical data during the Santa Clause Rally, there’s a 75% chance the SPY will gain 0.95% over the next two weeks.

But this is supposed to be about January, so let’s get to it already. The S&P 500 starts strong (as shown in the previous image), but then it tends to trail off during the back half of January.
So, what might be a better play? Small-cap stocks often outperform in January because of tax-loss harvesting in December and re-investment in January. Institutional investors tend to favor larger stocks, leaving small-caps more influenced by retail behavior.
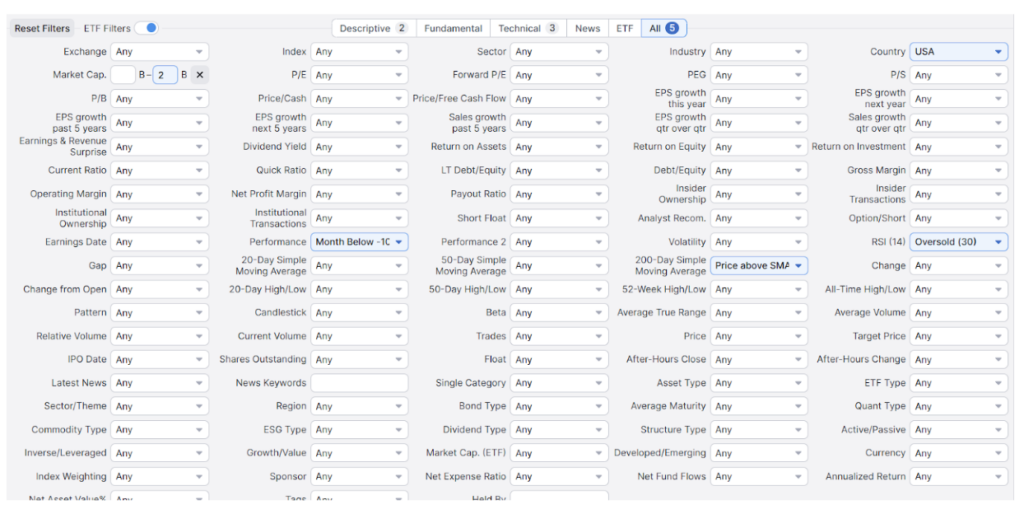
Let’s say that you want to scan for potential candidates. Let’s use FinViz and scan US stocks.
Basic Filters
- Market Cap: Less than $2 billion to focus on small-cap stocks.
- Performance: Down 10%-20% over the past month (to identify potential tax-loss selling).
Technical Filters
- Oversold Indicators: RSI below 30 or trading near the lower Bollinger Band.
Trend Indicators: Price above 200 simple moving average.

The results?

You can experiment with the indicators and review the charts to determine whether the stocks meet your investment objectives.
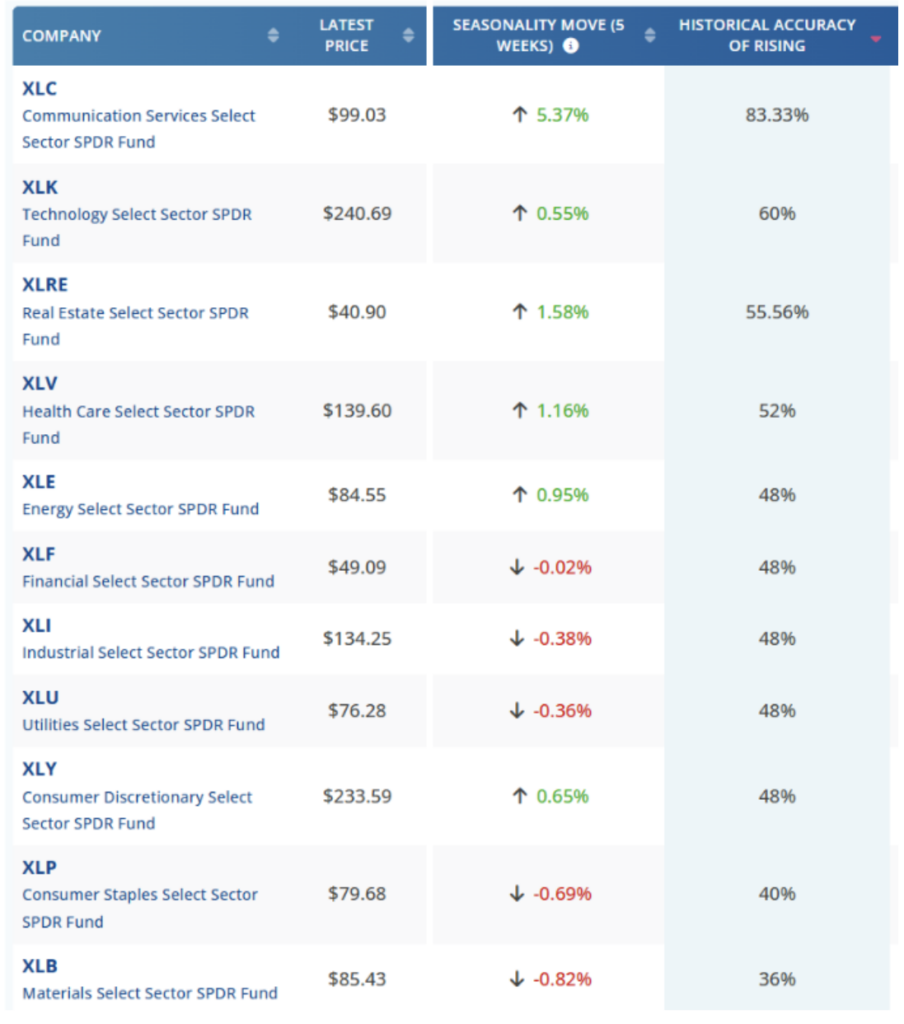
If small caps aren’t your thing, you can still break down the S&P 500 into sectors that tend to outperform in January. Let’s look at the estimated data over the next five weeks.

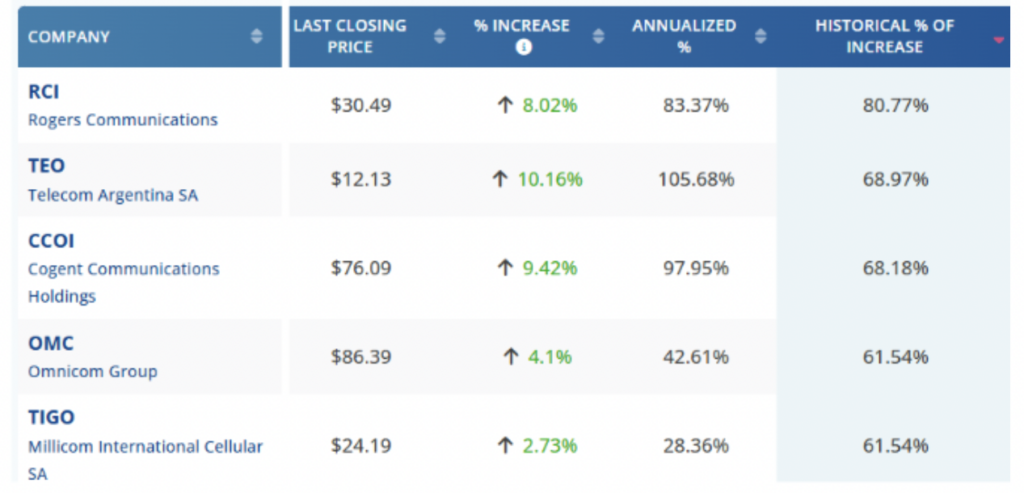
Within that sector, we can drill down further and look at individual stocks. From the following chart, we see that Rogers Communications (RCI) has risen over the next 5-week period over 80% of the time. Will it happen again this year? We don’t know, but it is worth seeing if that fits into your watchlist.

The January Effect offers a compelling seasonal opportunity for traders and investors to explore. While large-cap stocks often take the spotlight, the shift in behavior due to tax-loss harvesting and reinvestment can make small-cap stocks worth a look.
By leveraging tools like FinViz and applying strategic filters, you can uncover potential candidates that align with your investment goals. Whether you dive into small-cap stocks or hone in on specific sectors, January presents a unique window to capitalize on market dynamics. As always, thorough research and a clear plan are key to navigating these opportunities successfully. Happy trading!
I’ll see you in the new year!


