It’s no secret: the market’s a mess right now. The S&P 500 (SPY) took a beating in mid-February, at one point dropping nearly 10% off its highs. Now, traders are asking: when will a relief rally hit, and how high could it go? A modest bounce could take SPY back to $565–$575, while a stronger rally might push it toward $590.

But that depends on a mix of economic data and geopolitical events. Or we might have to admit that the relief rally is already behind us.
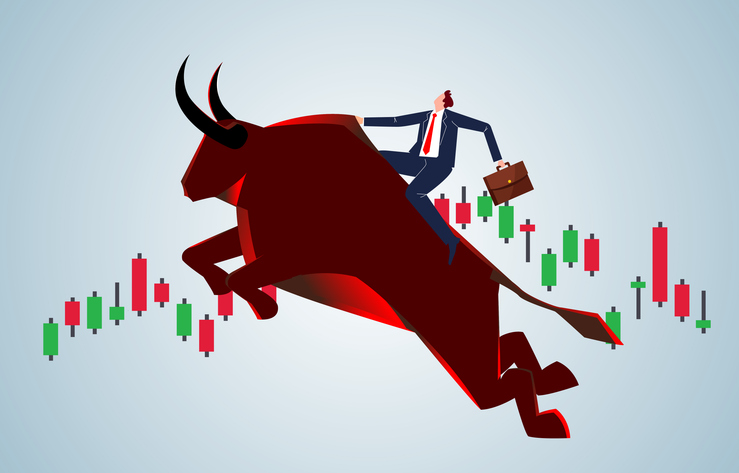
How to Profit in a Down Market
Not everyone can—or wants to—short stocks or trade options. But there’s still a way to play the downside: inverse ETFs. These tickers—SDS, SH, SPXU, and SPXS—go up when the market goes down. Some of them use leverage, meaning if the S&P 500 drops 5%, a 2x inverse ETF like SDS could climb 10%.
Year-to-date, SDS is up 10% while SPY is down 4%.

Even if your broker limits short-selling, inverse ETFs let you hedge without extra risk.
Finding Strong Stocks in Weak Markets
What if you want to bet on a rebound instead? Some sectors get oversold, but that doesn’t mean the trend is over. Timing a bounce requires identifying which areas of the market are most stretched.
One way is to check how many stocks in a sector are trading above their 20-day moving average. Right now, only about 10% of Consumer Discretionary and Tech stocks are above this level. That’s extreme.

Historically, when fewer than 15% of stocks in a sector trade above their 20-day moving average, reversals aren’t far off. Compare the periods when the stocks trading above their 20-day moving average within the S&P 500 Information Technology Sector are 15% or less against the price performance chart (bottom) of the sector.

Step-by-Step Stock Selection
Once you’ve spotted an oversold sector, the next move is finding stocks within it that are already outperforming the broader market. Here’s the process:
- Scan for stocks beating the market year-to-date (YTD Performance vs S&P 500). Even in a downtrend, some names hold up better than others.
- Filter for stocks that are up over the past five trading days. This confirms relative strength.
- Look for names that haven’t run too far yet. The goal is to catch them before they break out.

Example: Teledyne Technologies (TDY)
Tech has been under pressure, but Teledyne (TDY) is showing resilience. It’s up nearly 2% in the past five days, outperforming both its sector and the market. That’s a strong signal.
Switching to a point-and-figure (P&F) chart, TDY recently flipped into a column of X’s—a bullish signal. If it clears $496, the next resistance is around $520, offering a potential trade setup. Even as the broader market dropped 1% yesterday, TDY gained 0.25%, a potential sign it has the strength to keep moving higher regardless of the broader market. It may even be a leader to help bring up the rest of the market.

Bottom Line
Choppy markets don’t mean you’re out of options. If short-selling isn’t your thing, inverse ETFs let you hedge. If you prefer to trade on the long side, start by analyzing sectors from the top-down: find oversold areas, identify outperforming stocks, and look for potential entry points. Even in tough conditions, opportunity is always there—you just have to know where to look.