The Santa Clause Rally already happened in November as December put up the second-to-worst month of S&P 500 returns for the entire year. Even Thursday’s return to trading started strong only to suffer from a mid-day reversal and now investors are left trying to figure out if the bull run can continue. What sectors could help this sluggish bull market kick into high gear in the new year?
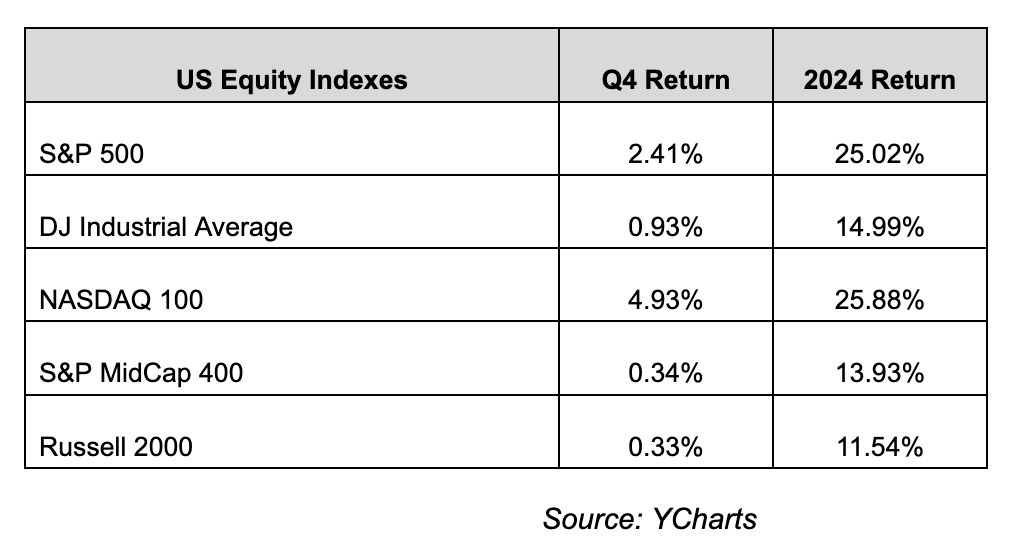
Despite December’s retreat, the S&P 500 managed to squeak out a gain for the fourth quarter, helping the market finish with back-to-back yearly gains of 20% or more.

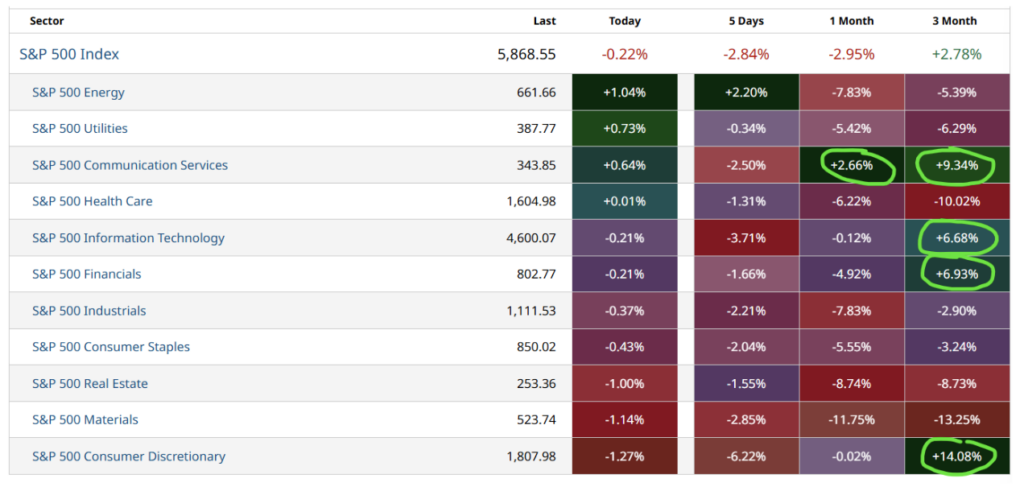
Investor’s optimism fell like a lead balloon with the Fed’s decision to slow down rate cuts in the new year. That sent sectors like the S&P 500 Materials and Real Estate heading for the hills. There were a few bright spots for the last 3 months, including the tech-heavy Communication Services, Information Technology, and Consumer Discretionary. Most other sectors fell apart over the last month, which helped put them into negative territory over the previous 3-month period.

December showed that this bull is facing some headwinds coming into the new year. The returns for December were bleak.

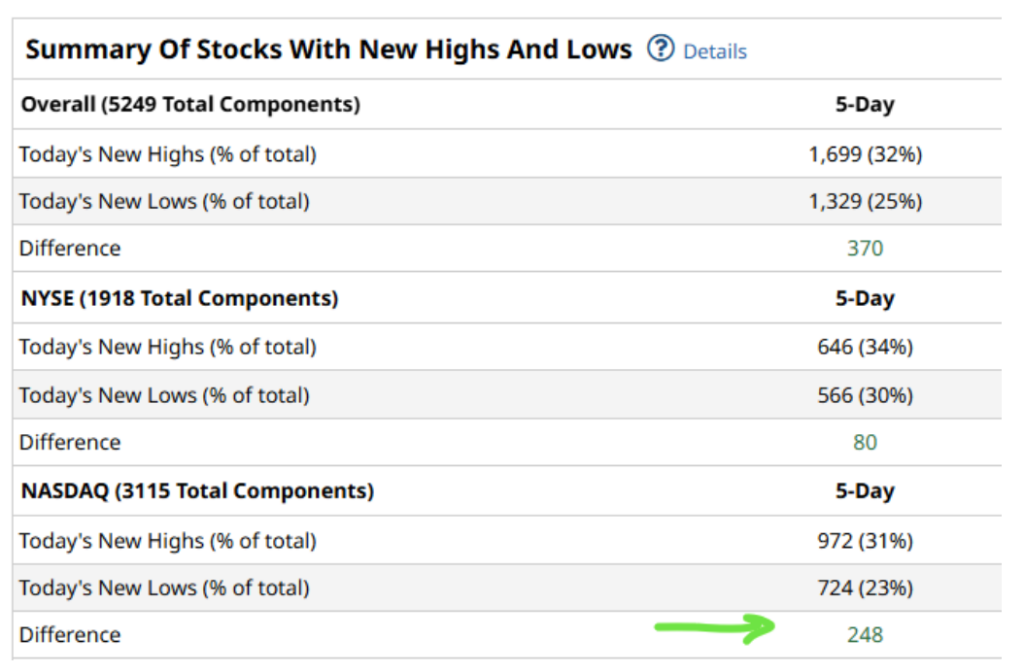
So where can we turn to at the start of the year? With growth stocks once again dominating 2024, it’s no surprise to see more Nasdaq stocks making new 5-day highs to start the year.

Roughly 32% of the NYSE and Nasdaq stocks made a new 5-day high. It’s not much, but it’s something the bulls can hang on to after how the year closed.
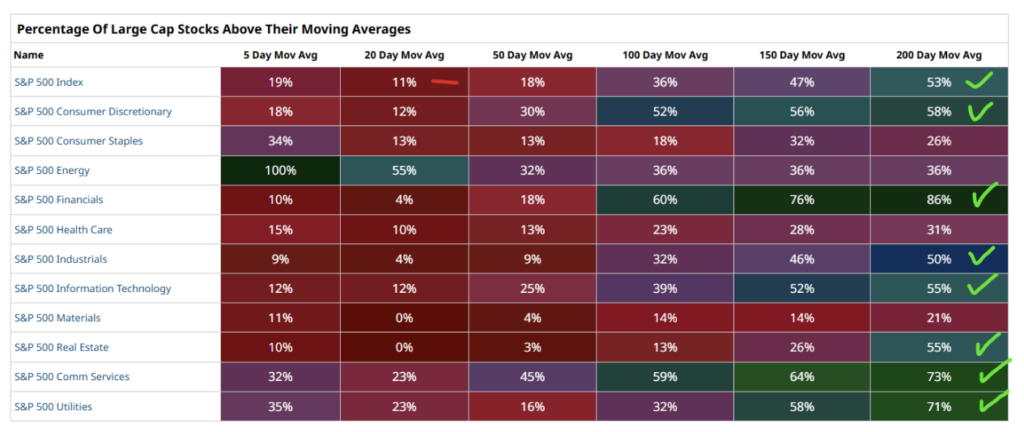
Looking at the data another way, we can see that the majority of the S&P 500 sectors have the majority of their stocks above their 200-day moving average, so the bulls are hanging on, but looking over to the left we can see that there is only one sector with the majority of its stocks above the 20-day moving average.

This is showing that the bears are coming into the market. When the overall S&P 500 has a percentage score of less than 30% of stocks trading above their 20-day moving average, I will look for a pairs trade by trying to find the strongest sector to buy and the weakest sector to sell. I think the S&P 500 is oversold at these levels, but we are sitting on a key support level so a pairs trade will look to take advantage of a move in the broader index no matter which way that goes.
Based on the chart above, S&P 500 Energy (XLE) is the “strongest” sector and the S&P 500 Materials and Real Estate are tied for the worst.
That means I’m looking to do a bull put (neutral to bullish) trade on the XLE this month and I’m looking to do a bear call (neutral to bearish) trade on the XLRE.
Depending on the open interest and volume of the sectors, it may be more beneficial to trade the ETF rather than the option on the ETF.
Another way to start the year is to look at the sectors that still have the majority of stocks above their 200-day moving average and then pick the sector with the least amount above the 20-day and narrow down the sector to stocks that might be oversold. Look for a reversal pattern (or your favorite indicator) to lead you to your entries.
For example, I think Financials are a bit oversold at current levels (only 4% above their 20-day yet 86% above their 200-day moving averages). Next, I’ll go into the XLF and find the individual ticker that I think is likely to rebound from here.
We will see what the next week of trading brings, but for now, I hope everyone is getting ready for what could be a volatile year ahead. We will certainly do our best to get you on the right path.


