Earlier in the week I presented a bullish case for the markets to rise through the rest of the year, but then Thursday happened and the Russell 2000 dropped over 1%. The Dow followed suit and was down just over 0.5%. What happened and what could stop the end of the year holiday rally? The Ghost of Christmas Past.
Okay, it’s not a ghost per se, but Fed Chairman Jerome Powell’s comments keep haunting the markets. Every time the market surges, he seems to like to make statements reminding everyone he’s still in charge.
On Wednesday he said that diminishing downside risk to the labor market suggests there’s no rush to cut rates again. In other words, “We can afford to be a little more cautious as we try to find neutral,” the interest-rate level at which monetary policy is neither restrictive nor accommodative.
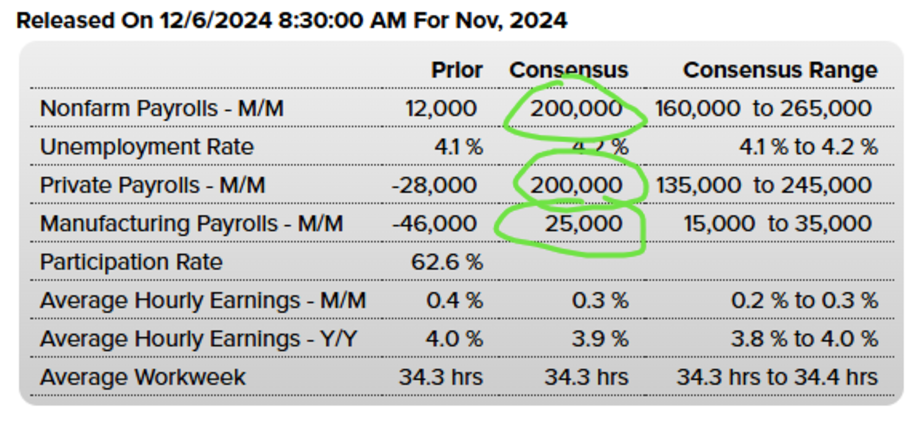
Let’s look at the data. After October’s hurricane-loaded report, the consensus is that November will rebound nicely.

If the jobs report is too strong, Powell and the Fed may delay a December rate cut. Just how strong would it need to be?
I think we’d need to see 300k+ jobs created to compensate for the hurricanes and strikes from last month. I don’t think that is likely to happen because the Unemployment Rate is expected to increase ever so slightly from 4.1% to 4.2%. That’s not a reason to be worried about a recession, but it could make the Fed more comfortable with a December rate cut.
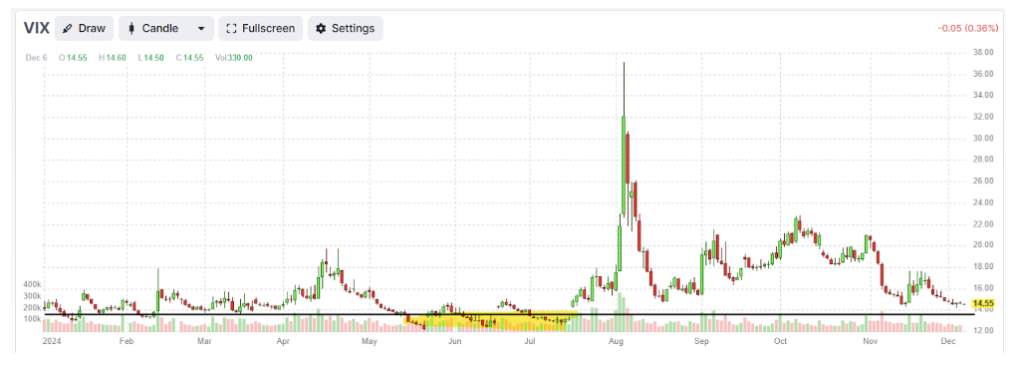
Judging by the Volatility Index (VIX), investors don’t seem too concerned, but it wouldn’t be the first time investors get lulled into complacency.
The VIX typically has an inverse relationship with the S&P 500, and the VIX is nearing $14, which has been a pivot point (except June and July).

If the VIX is near a pivot point (black line), and starts rising, that means the S&P 500 may be poised to take a breather instead of continuing the latest surge higher.
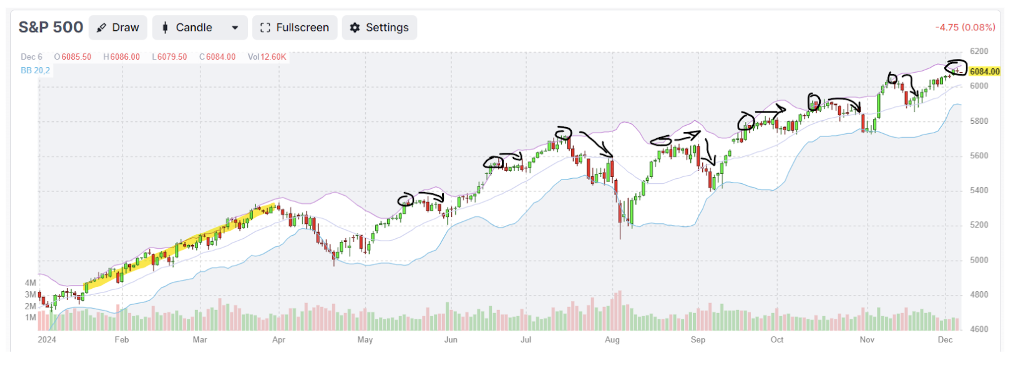
I don’t often talk about Bollinger Bands in these articles, but let’s look at the S&P 500 using the popular indicator.
Bollinger Bands are a technical analysis tool that helps traders identify volatility and potential price trends. They consist of three lines: a moving average (middle band) and two outer bands calculated based on standard deviations of price. When prices move close to the outer bands, it can indicate overbought or oversold conditions, while contractions suggest periods of low volatility that may precede a breakout.
It’s a little hard to see, but the index pierced the top of the Bollinger Band and if history shows us anything, the expectation this year is neutral to slightly lower movement from here, but the good news is that most of the time the market found support at its 20-day moving average, which is around $6000.

As you can see from the image, a cross above the Bollinger Band doesn’t mean a sell off ensues. With the VIX near yearly lows and the index near the top of the Bollinger Band, it may be worth taking some profits or tightening up some stops.
Of course if the jobs report comes out with favorable results, we could see another slow climb higher with the index hugging the top of the Bollinger Band.
While I’ve been writing a lot about the Santa Clause rally, the official term refers to the last five trading days of the year and the first two trading days of the new year. It is a period where the stock market often experiences a seasonal rise, attributed to holiday optimism, year-end tax planning, and lower trading volumes. This phenomenon was first observed and named by Yale Hirsch of the Stock Trader’s Almanac.
If that’s the case, I’m okay with a little bit of a market breather if that sets up the sling shot for a surging Santa Clause Rally!
That’s it for me this week. Take care. Have a great weekend!


