
After the Fed announced the first rate cut, the market has been rallying to new all-time highs. And why wouldn’t it? The GDP report was in line with expectations, unemployment claims came under expectations, and Fed Chairman, Jerome Powell, said he is dedicated to keeping the US Treasury market – the deepest and most liquid in the world – functioning at a high level.
The bullishness has pushed the S&P 500 to be on pace to do something it hasn’t done in the last four years. It might close September in the green, but how long can this rally last?
Don’t look now, but the S&P 500 is about to buck the September seasonal trend. Over the last four years, the index was unable to get a win in September, with an average loss of -5.6%.
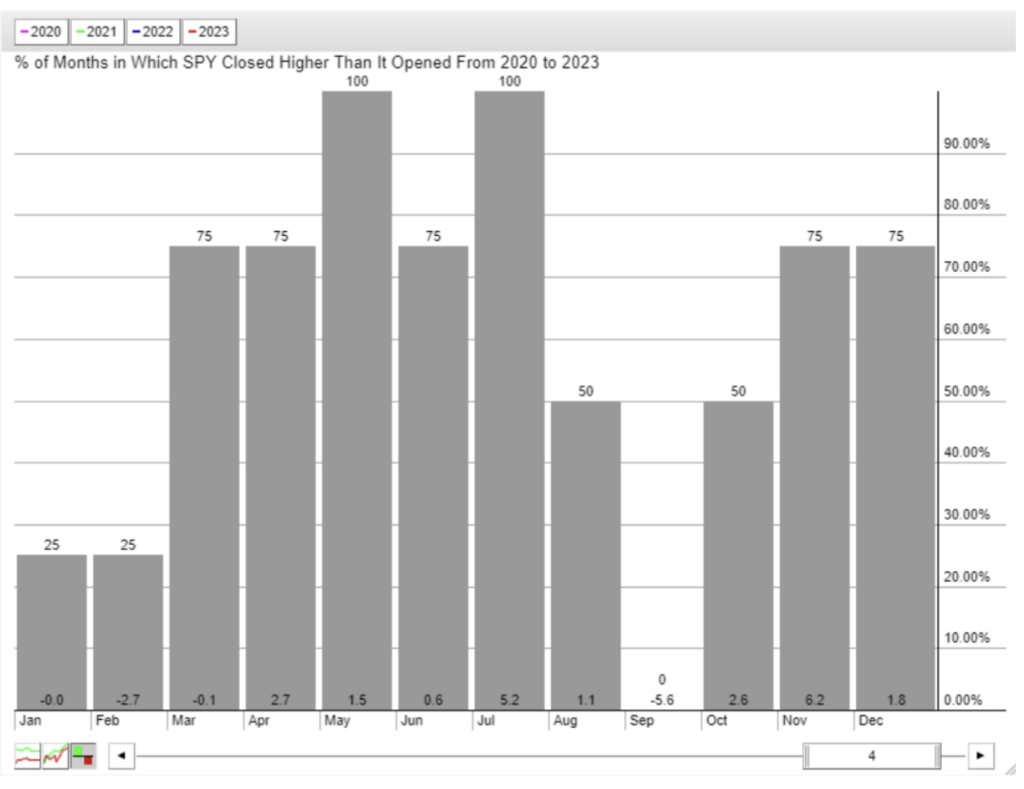
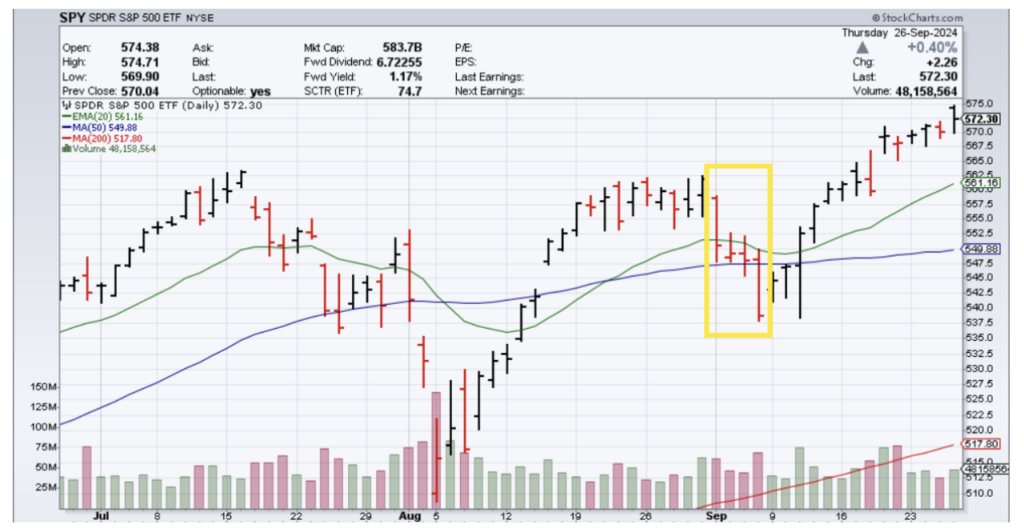
And while we started the month on a bearish note, it has since rebounded nicely.
But that’s all that has happened and we want to know what’s next, right?
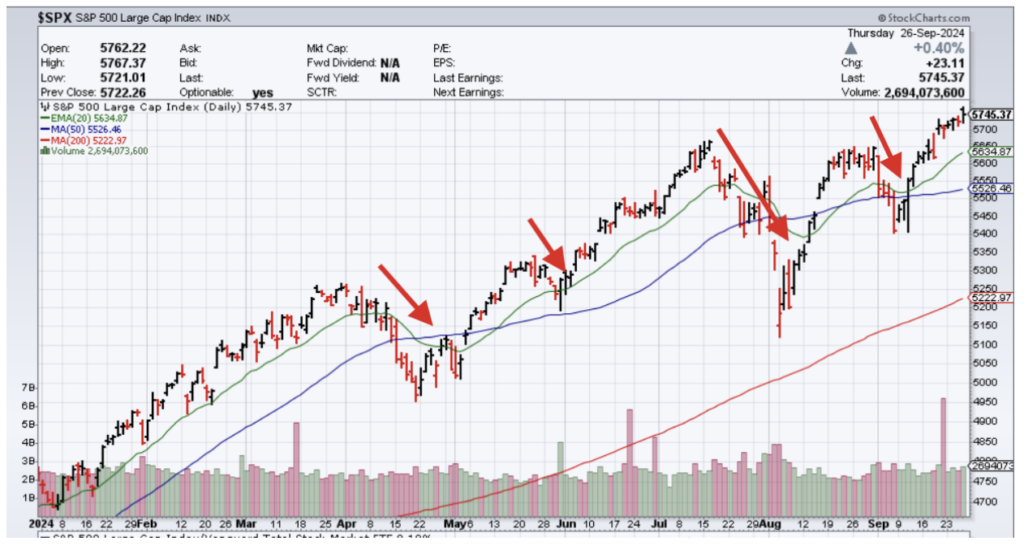
It may not have seemed like it at times, but 2024 has been in a strong uptrend for most of the year, with four decent-sized pullbacks. Despite that, the market is currently up over 20% for the year!
A 20% move in the market is unique enough. Since 1928 there have been 34 calendar years where the S&P 500 finished up 20% or more. That’s 36% of the last 95 years.
What’s even more rare though is that 2023 also finished with a greater than 20% move. We are looking at the potential of having back-to-back 20% years!
The last time that happened was 1998 as the dot-com bubble was getting frothy. The advent of the internet pushed the S&P 500 to gain more than 20% for nearly five years in a row. Before that, it was 1955 before the market had such a move two years in a row.
Does this mean the stock is overbought or headed for a retracement? Quite the contrary. The average return of the S&P 500 is 9% after a year with a 20% rise. At current prices, that means the S&P 500 could reach $6262 by the end of 2025.
If we look at the monthly chart of the SPY, we can see that based on the last impulse move higher from 2020 to 2022, a repeat of that size move from October 2022 would indeed put the S&P 500 right around that $6000+ level.
Will that happen? There’s a lot more trading left this year, especially with the looming port strike that looks like it will happen in early October.
No matter what happens, there will be opportunities to trade and that’s what we will keep doing.
Have a great weekend!